Benchmarking
OWL-SDA can capture a live snapshot of a run's state - message logs, contexts, triple store - as it happens, giving you full visibility into how the run is progressing without waiting for it to finish. Layout under output-dir:
output-dir/live/- the currently in-progress (or most recently finished) run. Its files are overwritten in place every time a snapshot is captured, so you can watch this one folder while a run is happening instead of finding results only after it completes.output-dir/archive/<timestamp>/- previous runs, moved here (not deleted) the next time a run starts, so history across multiple runs is preserved instead of being silently overwritten.
While a round or review iteration is still in progress, a background ticker captures a snapshot (stage LIVE) into live/ every live-interval-seconds, in addition to the snapshot captured at each round/review boundary.
Enabling Benchmarking
benchmark:
  enabled: true
  output-dir: "target/benchmarks"
live-interval-seconds: 15| Key | Type | Default | Description |
|---|---|---|---|
enabled | boolean | false | Enable benchmark snapshot collection. |
output-dir | string | target/benchmarks | Parent directory holding live/ (the current run) and archive/ (previous runs). |
live-interval-seconds | long | 15 | How often, in seconds, a LIVE snapshot is captured while a round/review iteration is still running. |
At the start of each run, if output-dir/live/ holds data from a previous run, it's moved to output-dir/archive/<timestamp>/ (named after that run's last snapshot) before the new run starts writing to a fresh live/.
What Is Captured
All of a run's state lives directly under live/ (no per-round sub-directories within it) and is overwritten in place on every snapshot:
| File | Description |
|---|---|
metadata.txt | Key/value properties for the most recent snapshot only - see below. |
triplestore.ttl | Full contents of the shared triple store at the time of the snapshot. |
triplestore-summary.txt | Triple count and snapshot time. |
triplestore-error.txt | Written instead of the summary when serialising the triple store failed; contains the error message. Its presence means triplestore.ttl is stale or missing. |
supervisor_context/ | All context entries active in the supervisor session, one .txt file per context. |
reviewer_context/ | All context entries active in the reviewer session. |
worker_contexts/worker_N/ | Context entries for each worker session, prefixed round_N- once delegation rounds start. |
*/Validation Report.txt | The current SHACL validation report, written inside whichever role's context directory holds it. This is what the dashboard's violations view reads. |
message_logs/ | Full JSON message transcripts (supervisor-messages.json, reviewer-messages.json, worker_N-messages.json), as they stand right now. |
output.ttl | Copy of the generated output file at snapshot time (named after your configured output-path). |
owlsda.log | Copy of the log file (only when log-to-file: true). |
benchmark-summary.json | The one file that is not overwritten - see below. |
A snapshot is skipped (nothing is written) when nothing has changed since the previous one - by content hash of the message logs, contexts, triple store, and token counts - so a quiet run doesn't waste writes. Both the round/review-boundary snapshot and the periodic LIVE ticker call into the same synchronized write path, so a tick landing right as a round finishes can't corrupt or drop the round's own entry.
metadata.txt
A flat key=value properties file describing the latest snapshot. Beyond the run counters it also records, per role, which model and provider are in use, whether the role is mid-prompt, and how full its context window is - these are the fields the web dashboard's live indicator and context gauge are built on.
| Key | Description |
|---|---|
stage | Stage of this snapshot (see Stages). |
shapes_processed | Number of shapes processed so far. |
duration_ms | Duration of the round or iteration this snapshot closes. |
timestamp | Snapshot id, e.g. 20260409_150145_970. |
triplestore_size / triplestore_empty | Triple count, and whether the store is empty. |
current_violations | Outstanding SHACL violations. |
model.<role> / provider.<role> | Model name and effective provider per role (supervisor, reviewer, worker), with the role's provider override resolved against client.provider. |
tokens.<role>.{input,output,total} | Cumulative token usage for supervisor and reviewer. |
tokens.worker.worker_N.{input,output,total} | Cumulative token usage per worker. |
busy.<role> | true while that role is waiting on a model call. Worker keys are busy.worker.worker_N. |
context.<role>.used | Prompt tokens of that role's last call - a point-in-time figure, not a cumulative sum. |
context.<role>.limit | The role's configured context-window-tokens (0 when unset). |
JSON Summary
Every snapshot appends one entry to live/benchmark-summary.json - this is the one file in the run that grows over time rather than being overwritten, because it's what preserves progress-over-time history for plotting even though the rest of the run directory only ever shows the latest state:
[
  {
    "timestamp": "20260409_140831_530",
    "stage": "GENERATE",
    "shapesProcessed": 10,
    "durationMs": 93059,
    "triplestoreSize": 128,
    "triplestoreEmpty": false,
    "currentViolations": 0,
    "tokens": {
      "workers": {
        "worker_0": { "input": 0, "output": 0, "total": 8363 },
        "worker_1": { "input": 0, "output": 0, "total": 7042 }
      },
      "reviewer": { "input": 0, "output": 0, "total": 0 },
      "supervisor": { "input": 0, "output": 0, "total": 6946 }
    }
  }
]
Every token figure - workers, reviewer, and supervisor alike - is an object with input, output, and total. Providers that don't report a directional split leave input and output at 0 and only fill total.
Older summaries look different: they store each role's tokens as a bare integer ("supervisor": 24990) and carry an extra snapshotDirectory field that current runs no longer write. examples/project-1/benchmark_paper/benchmark-summary.json is in that older shape; examples/project-2/benchmark_paper/benchmark-summary.json uses the nested one. The plotting script accepts both.
Stages
| Stage | When it occurs |
|---|---|
LIVE | Every live-interval-seconds while a round/review iteration is still in progress. |
GENERATE | After each supervisor delegation round. |
FINALIZING | After the supervisor finalises the assembled output for consistency. |
REVIEW_ITERATION_<n> | After review iteration n completes without a verdict, e.g. REVIEW_ITERATION_1. |
REVIEW_ACCEPTED | When the reviewer signals ACCEPTED. |
REVIEW_REJECTED | When the reviewer signals REJECTED. |
Those six are the complete set - there is no plain REVIEW stage. The plotting script groups every REVIEW_* stage under a single "REVIEW" band when colouring its charts, which is presentation only.
Watching a Run Live
Pass --web-ui to watch messages, tool calls, stages, and output in a browser instead of reading these files by hand. It reads benchmark.output-dir/live straight from disk on every request, so it needs benchmark.enabled: true:
java -jar target/owlsda.jar --config config.yml --web-uiSee Web UI for what the dashboard shows, and Command Line Interface for the related options.
Visualising Results
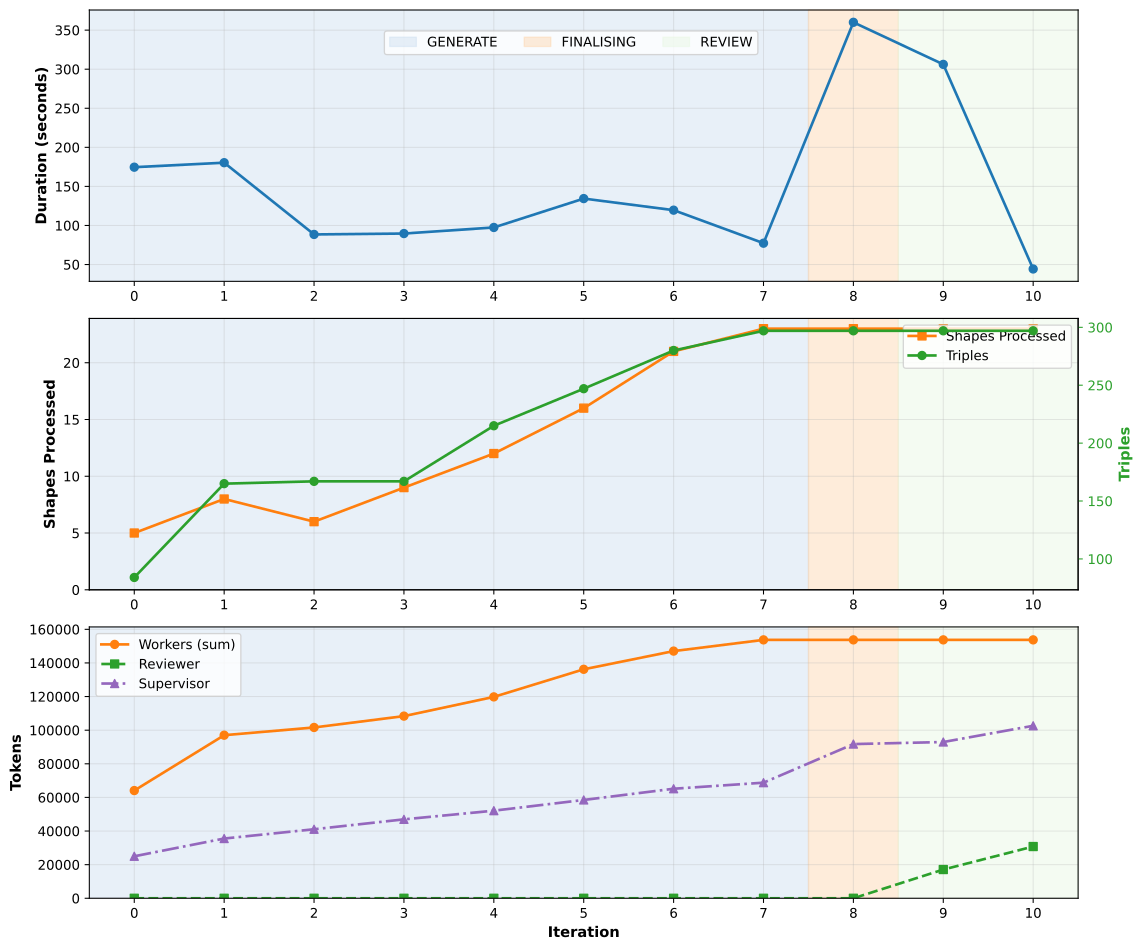
scripts/plot_benchmark.py turns a run's benchmark-summary.json into charts and summary statistics. It takes no positional argument - point it at a directory containing benchmark-summary.json:
# a specific run directory
python scripts/plot_benchmark.py --benchmark-dir examples/project-2/benchmark_paper

# every examples/*/benchmark_paper directory in one go
python scripts/plot_benchmark.py --all

# also open the chart in an interactive window
python scripts/plot_benchmark.py --benchmark-dir target/benchmarks/live --show| Option | Default | Description |
|---|---|---|
--benchmark-dir | ../examples/project-2/benchmark_paper | Directory holding benchmark-summary.json. Relative paths are resolved against the repository root, and a leading ../ is stripped, so the same value works from the repo root or from scripts/. |
--all | off | Process every examples/*/benchmark_paper directory instead of a single one. |
--show | off | Display the chart interactively as well as saving it. Without it, a non-interactive backend is used. |
It writes five files into that same directory:
| File | Contents |
|---|---|
benchmark_plot.png | Three stacked charts (duration, shapes/triples, tokens) at 150 dpi. |
benchmark_plot.svg | The same chart as vector graphics. |
benchmark_plot.pdf | The same chart as a PDF with embedded TrueType fonts. |
benchmark_stats.txt | Human-readable totals: iteration count, total/mean/median/min/max duration, shape and triple counts, shapes per second, and per-role token totals. |
benchmark_stats.json | The same statistics as JSON. |
Requires Python 3 with matplotlib.
About the Bundled benchmark_paper Directories
examples/project-N/benchmark_paper/ is a hand-curated snapshot kept for the paper, produced by an earlier version of OWL-SDA (see each directory's NOTE.txt). It uses the old flat layout - one directory per snapshot at the top level - from before live/ and archive/ existed, so it is not what a run produces today.
Actual runs write to whatever you configure as benchmark.output-dir; for the bundled examples that is examples/project-N/benchmark/, which is gitignored. Use benchmark_paper/ as reference data for the plotting script, not as a description of the current output layout.
Example benchmark chart - Project 1
Example benchmark chart - Project 2
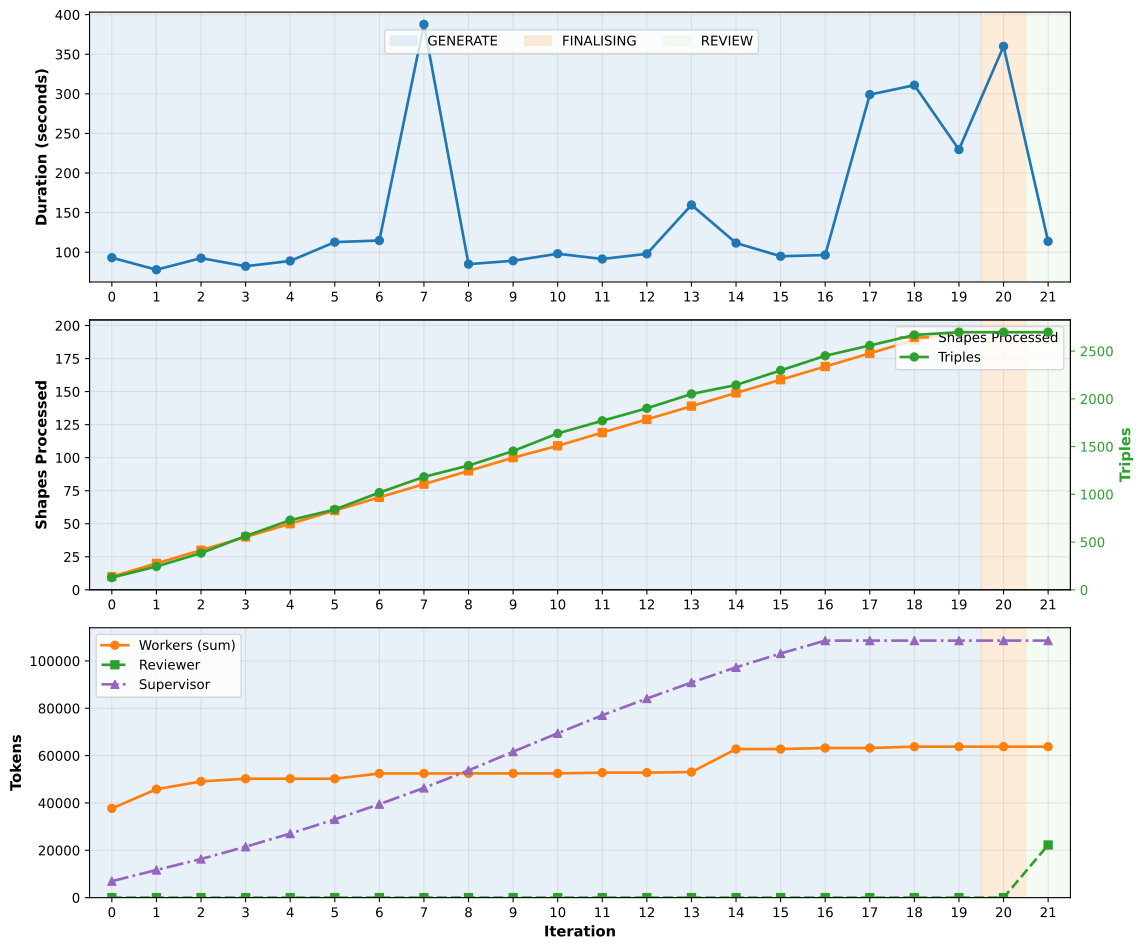
The numbers behind these charts are discussed in Examples.