Web UI
OWL-SDA ships with an opt-in local dashboard that shows a run as it happens: the stage timeline, every agent's messages and tool calls, the shared triple store, the output file, and trend charts for triples, violations, and shapes over time.
The dashboard is read-only. It renders the benchmark output directory from disk, so it never interferes with the run.
Starting it
java -jar target/owlsda.jar --config examples/project-1/config.yml --web-ui| Option | Default | Notes |
|---|---|---|
--web-ui | off | Starts the dashboard on http://localhost:8080. |
--web-ui-port | 8080 | Port to listen on. |
The dashboard reads the benchmark output, so benchmark.enabled: true must be set in your config — without it the page shows a "Waiting for benchmark data…" placeholder and OWL-SDA logs a warning at startup. See Configuration for benchmark.enabled, benchmark.output-dir, and benchmark.live-interval-seconds.
The server keeps serving after the run finishes:
Run finished. Web UI still available at http://localhost:8080 -- press Ctrl+C to exit.Press Ctrl+C when you are done inspecting the results.
The page polls every 2.5 seconds. How often the underlying data changes is set by benchmark.live-interval-seconds (default 15), which controls how often a LIVE snapshot is flushed while a round is still running.
The dashboard
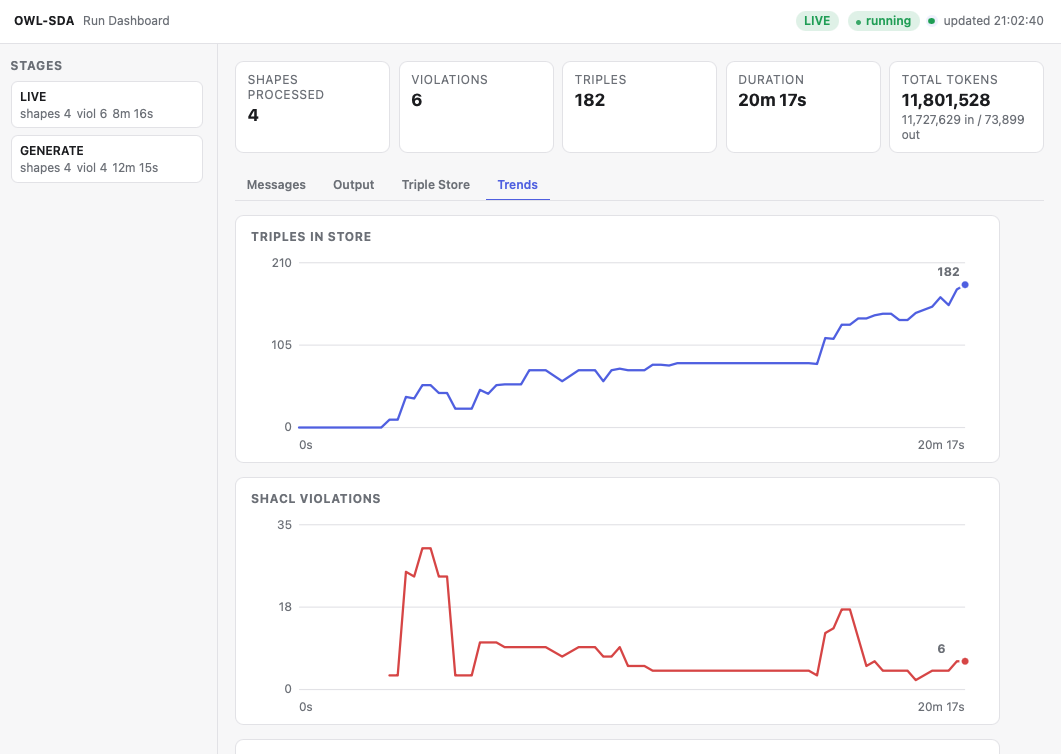
Header and stat row
The header carries the current stage badge (LIVE, GENERATE, FINALIZING, REVIEW_ITERATION_<n>, REVIEW_ACCEPTED, REVIEW_REJECTED), a running/idle indicator, a server connection dot, and the last refresh time. A run counts as "running" when the newest snapshot is younger than three live intervals (at least 30 seconds).
Five stat cards sit above the tabs: Shapes Processed, Violations, Triples, Duration, and Total Tokens (with an input/output split underneath). Duration is measured from the first snapshot of the run, not from the current stage.
The Violations card is clickable — it opens a modal with the full SHACL validation report, backed by /api/violations. Press Escape or click outside to close it.
Stages sidebar
Every snapshot in benchmark-summary.json appears as a row with its shape count, violation count, and duration, newest first. Consecutive LIVE ticks are collapsed into a single row with a multiplier, so only real milestones plus one "still working" entry are shown.
Tabs
| Tab | What it shows |
|---|---|
| Messages | One sub-tab per session role (supervisor, reviewer, worker_0, worker_1, …). Shows that role's full transcript with tool calls and their results merged into single cards, Turtle syntax highlighting, collapsible long bodies, and an auto-scroll toggle. Above the transcript, the role's current named contexts ("Delegation Instructions", "Validation Report", "Ontology Summary", …) are shown as collapsible panels. |
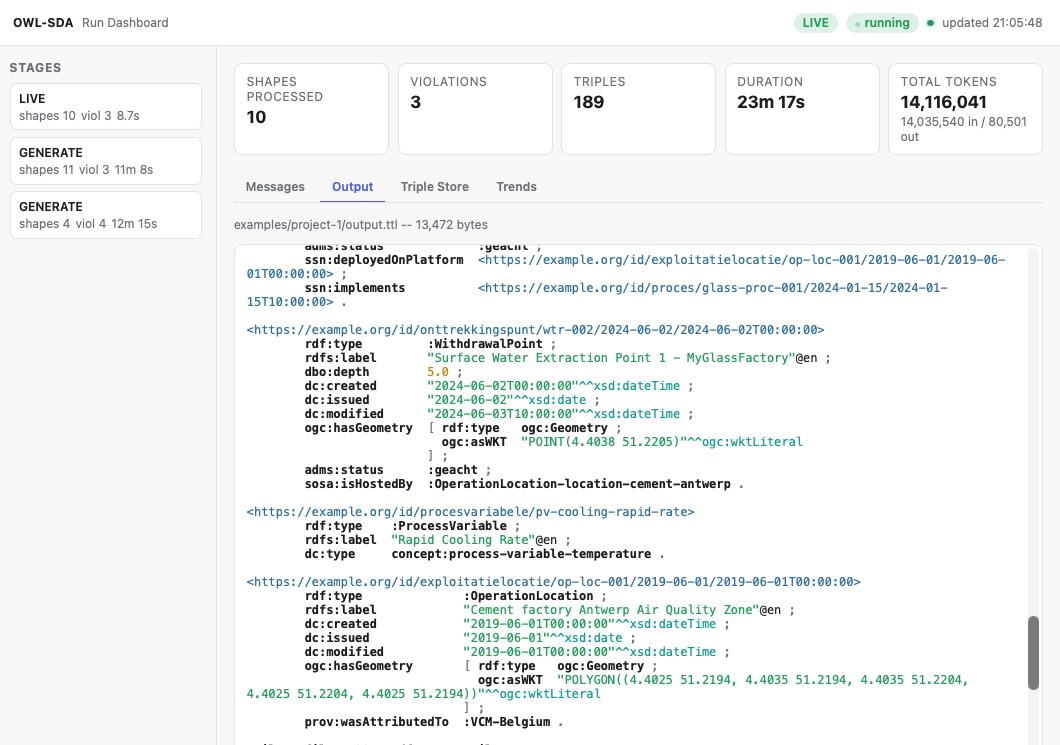
| Output | The current contents of the file at output-path, with size and Turtle highlighting. |
| Triple Store | The shared WorkerTripleStore dump (triplestore.ttl) from the latest snapshot. |
| Trends | Three line charts over the run's elapsed time: Triples in store, SHACL violations, and Shapes processed. Hovering shows a crosshair and a tooltip with the value and how far into the run it was. Unmeasured points (for example violations before the first validation) break the line rather than being plotted as zero. |
Live per-role indicators
Each role sub-tab in the Messages tab carries three live figures:
- A busy dot — whether that session is currently mid-prompt.
- The model name, with the provider in its tooltip.
- A context usage percentage, shown only when a context window is configured.
These come from metadata.txt, which SnapshotWriter refreshes on every snapshot:
| Field | Meaning |
|---|---|
model.<role> | Configured model for the role. |
provider.<role> | Effective provider, falling back to client.provider when the role sets none. |
busy.<role> | Whether the session is currently waiting on the model. |
context.<role>.used | Prompt tokens on the last completed call — not a cumulative total. |
context.<role>.limit | The role's context-window-tokens. Zero means unset, and the gauge is hidden. |
<role> is supervisor, reviewer, or worker.worker_N. Model and provider are written once per role rather than per worker index, since all pool workers share one configured model. Set client.<role>.context-window-tokens in the config to get a usage gauge at all.
HTTP API
The dashboard is a static page over a small JSON API served by WebUiServer. All endpoints are GET, take no authentication, and are stable enough to script against.
| Route | Returns |
|---|---|
/ | The dashboard itself (index.html, app.js, style.css — a fixed allowlist, no filesystem traversal). |
/api/state | { benchmarkEnabled, benchmarkDirExists, liveIntervalSeconds, metadata, roles }. metadata is metadata.txt as a flat object; roles lists the session roles that have a message log, ordered supervisor, reviewer, then worker_0… |
/api/history | The raw benchmark-summary.json array — one entry per snapshot, with stage, timestamp, shapesProcessed, currentViolations, triplestoreSize, durationMs, and token counts. [] before the first snapshot. |
/api/messages?role=<role> | That role's message log. TOOL_INVOCATION entries are enriched with a parsed tool: { name, arguments, argumentsAreJson }. 404 with {"error":"unknown role"} for an unknown role. |
/api/contexts?role=<role> | [{ name, content }] for the role's current named contexts. Files from earlier rounds (prefixed round_N-) are excluded, so this is the round in progress only. |
/api/triplestore | triplestore.ttl as { path, exists, sizeBytes, truncated, content }. |
/api/output | The file at output-path, same shape as above. |
/api/violations | The most recent Validation Report.txt held by any role (supervisor and reviewer are checked first), same shape as above. |
The three file endpoints truncate content at 2,000,000 characters and set truncated: true when they do.
Example:
curl -s http://localhost:8080/api/state | jq '.metadata.stage, .roles'
curl -s http://localhost:8080/api/history | jq '.[-1]'
curl -s http://localhost:8080/api/messages?role=worker_0 | jq '[.[] | select(.tool) | .tool.name]'
Where the data comes from
Everything the dashboard shows is read from <benchmark.output-dir>/live/ — the same directory BenchmarkService overwrites in place as the run progresses. Nothing is cached in the server, so restarting the dashboard against a finished run's directory replays it exactly.
See Benchmarking for the full snapshot layout, the archived runs under archive/<timestamp>/, and the offline plotting script.